


Data Analytics with Power BI
Data Analytics with Power BI helps you transform raw data into meaningful insights through powerful dashboards and interactive visualizations. Power BI is one of the most widely used business intelligence tools that enables professionals to analyze data, build reports, and support data-driven decision making in organizations.
This course focuses on data visualization, dashboard creation, data modeling, and real-world business intelligence tools so you can convert complex datasets into clear, actionable insights across different industries.
- Certificate in Data Analytics with GenAI-integrated curriculum
- Learn Excel, Python, SQL, Power BI, Tableau & Statistics designed for industry needs
Data Analytics Course

Data Analytics With Excel
Learn data cleaning, analysis, and reporting using Excel.Master formulas, pivot tables, dashboards, and real-world business use cases.
16 Weeks
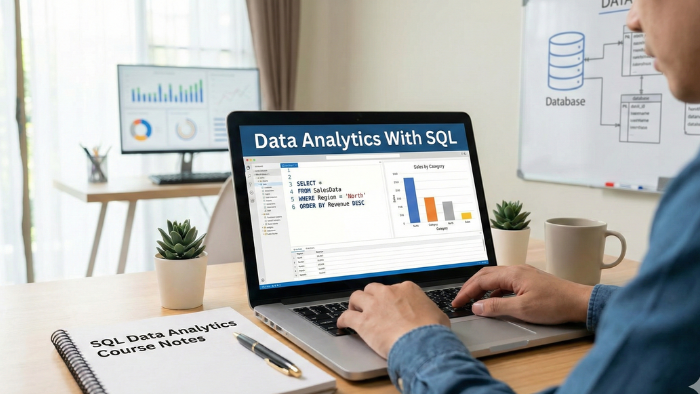
Data Analytics With SQL
Understand how to extract and analyze data from databases.Learn SQL queries, joins, subqueries, and data analysis for business.
16 Weeks
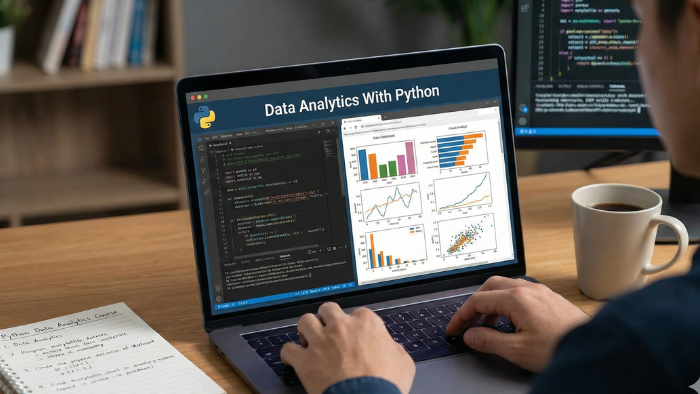
Data Analytics With Python
Analyze and visualize data using Python libraries. Work with NumPy, Pandas, Matplotlib, and real-world datasets.
16 Weeks
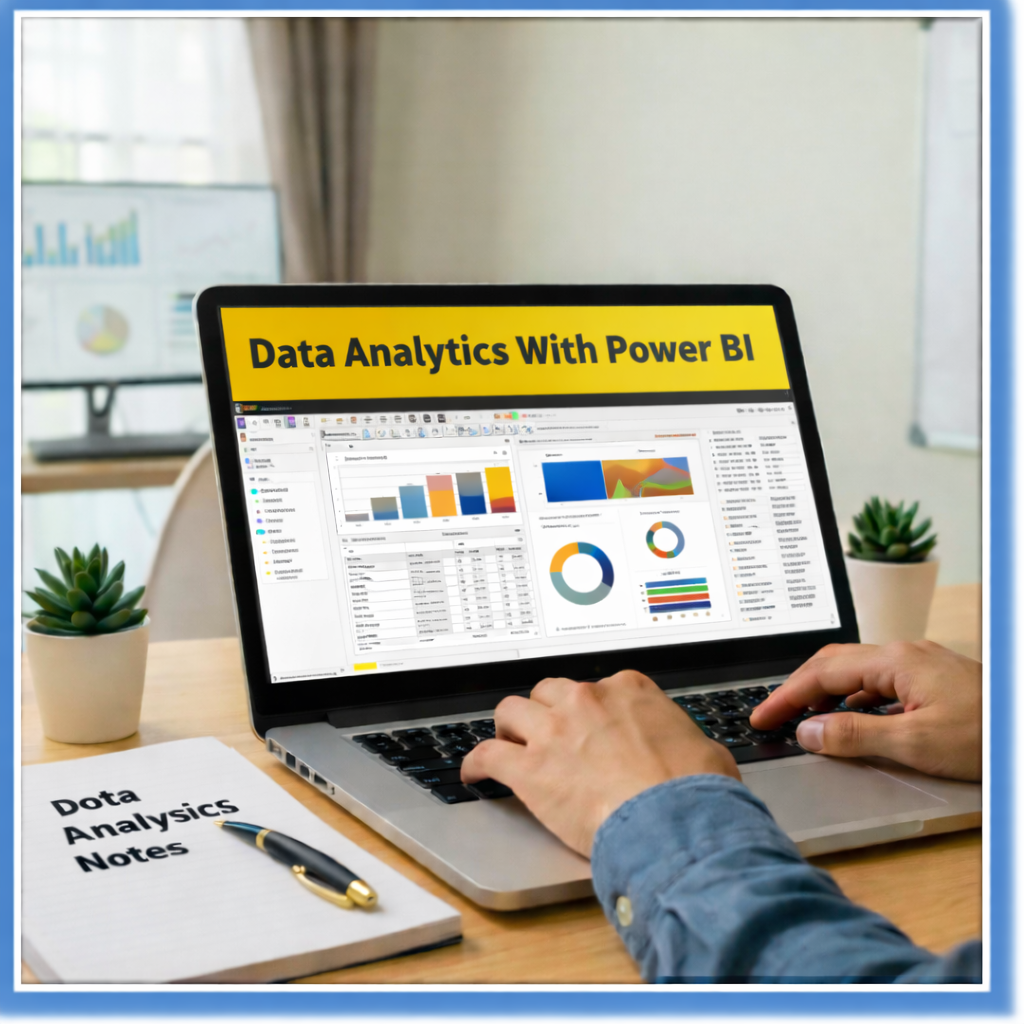
Data Analytics With Power BI
Create interactive dashboards and reports for decision-making. Learn data modeling, DAX, and advanced visual analytics.
16 Weeks
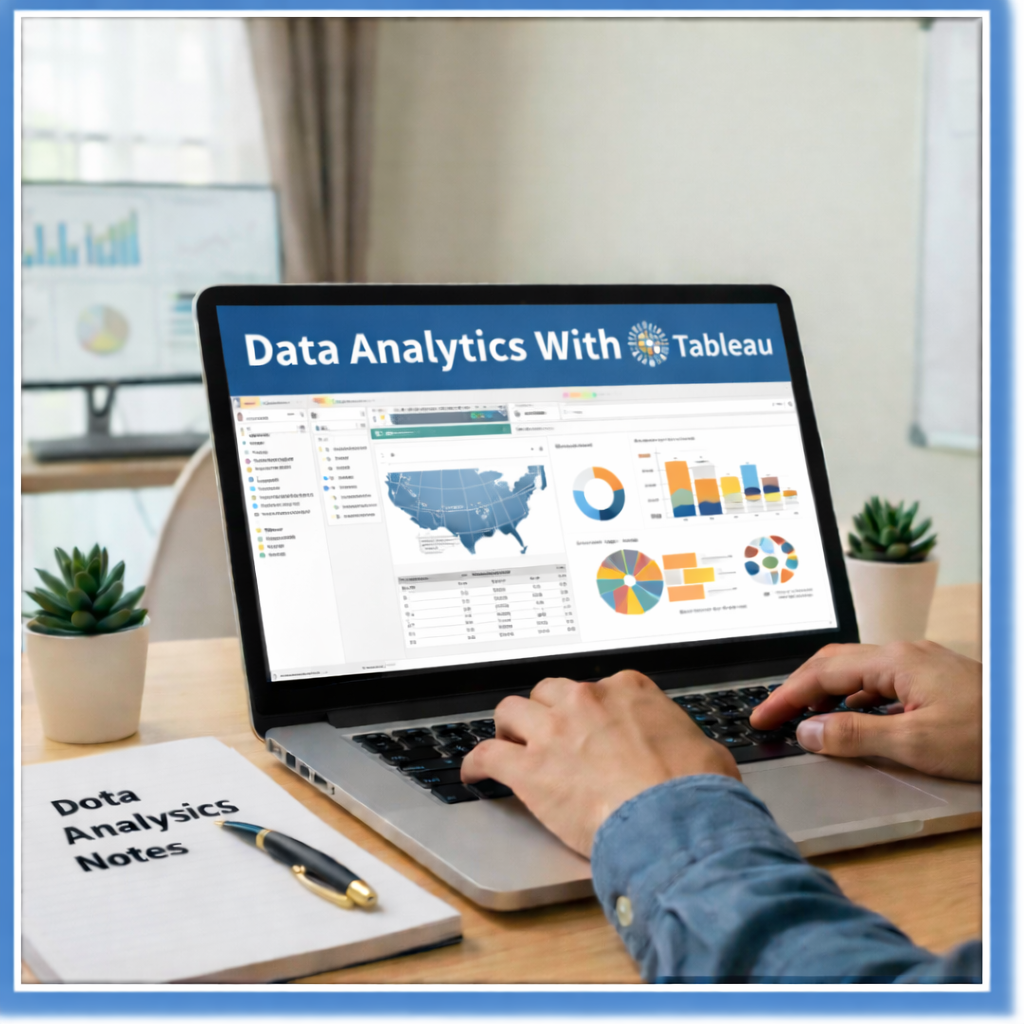
Turn raw data into meaningful visual stories. Build dynamic dashboards and visual reports used by top companies.
Data Analytics With Tableau
16 Weeks

Our Courses are Accredited
Best-in-class content by leading faculty and industry leaders in the form of cases and projects, assignments and live sessions
Start Learning For Free
Begin your journey with our free courses, a perfect starting point before the full data science programs.
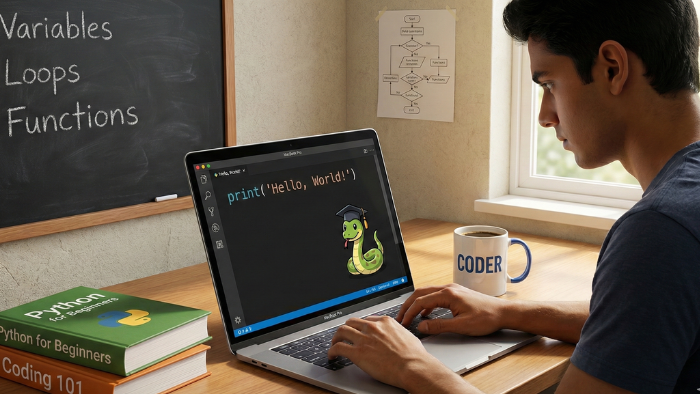
Learn Basic Python Programming
Solve coding questions based on Lists, Strings and other data structures like tuples, sets and dictionary to improve your problem solving abilities with Python
5 Hours
Start Your IT Career with Zappcode Academy

Introduction to Tableau
Learn how you can transform data into actionable insights by conducting data analysis and visualise it using various chart types in Tableau
8 Hours
Start Your IT Career with Zappcode Academy

Introduction to Natural Language Processing
Uncover the basics of NLP and other topics like RegEx for building tools for Spam Detection, Phonetic Hashing and Spell Correction in this introductory course
11 Hours
Start Your IT Career with Zappcode Academy
Overview
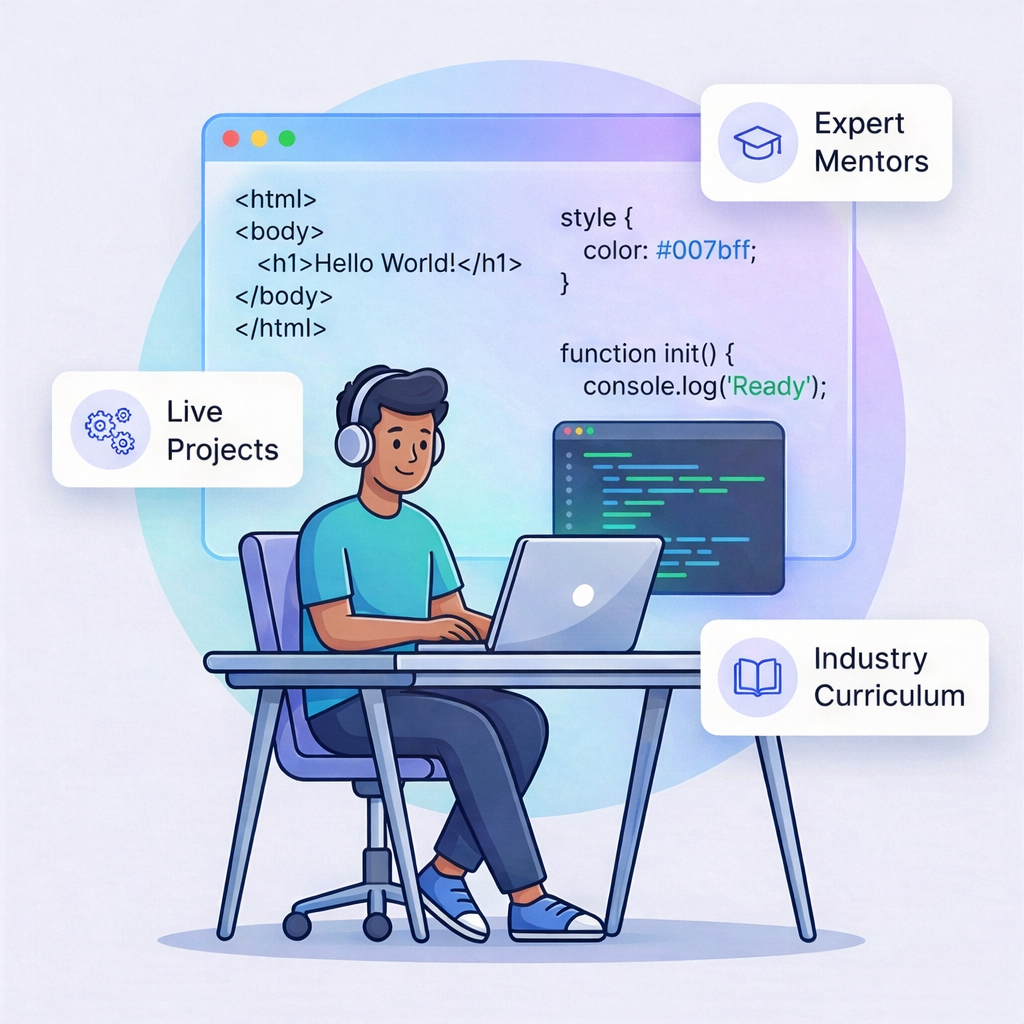
Looking to build a career in the rapidly growing field of data analytics using Power BI? Zappcode Academy offers a practical and job-oriented Data Analytics with Power BI Course designed to help you develop strong data visualization and business intelligence skills. With expert mentorship, real-time projects, and placement assistance, this course is perfect for students, freshers, and working professionals who want to start or advance their career in data analytics.
The Data Analytics with Power BI Course at Zappcode Academy is carefully crafted for learners who want to transform raw data into powerful visual insights and interactive reports. The program provides in-depth training in Power BI, data modeling, DAX functions, dashboard creation, and data visualization techniques, ensuring you gain hands-on experience in analyzing and presenting business data effectively.
We follow a project-based learning approach where learners work with real datasets, connect multiple data sources, build interactive dashboards, and create reports similar to what professional data analysts and business intelligence experts do in leading organizations. You will learn how to turn complex data into clear visual insights that support better decision-making.
Attend Free Demo
Fill the details and we will call you for further guidance
What You’ll Learn in Our Data Analytics Course
By enrolling in this course, you will:
1
Understand the complete lifecycle of data analysis
2
Work with Excel for data cleaning, formulas, and pivot tables
3
Master SQL for querying and extracting data from databases
4
Learn Python basics for data analysis using Pandas and NumPy
5
Build compelling dashboards using Power BI and Tableau
6
Perform data visualization and reporting for business needs
7
Analyze trends, patterns, and draw actionable insights
8
Apply skills to real-time datasets and case studies
Our focus is not just on tools but on building your problem-solving mindset as a data analyst.
Course Framework
Module 1
Introduction to Data Analytics
- What is Data Analytics?
- Roles & Responsibilities of a Data Analyst
- Tools & Career Scope
Module 2
Excel for Data Analytics
- Excel Basics, Formulas, Functions
- Pivot Tables & Charts
- VLOOKUP, HLOOKUP, IF Conditions
Module 3
SQL for Data Handling
- Database Basics
- Writing Queries, Joins, Aggregations
- Subqueries and Data Filtering
Module 4
Python for Data Analysis
- Python Basics: Variables, Loops, Functions
- Pandas for DataFrames and Manipulation
- NumPy for Numeric Data
Module 5
Data Visualization with Power BI & Tableau
- Creating Dashboards
- Filters, Slicers, and Charts
- Publishing Reports & Sharing Insights
Module 6
Capstone Project
- Real-world project using all tools learned
- Business case (Retail, Sales, HR, or Finance)
- Data preparation, analysis & dashboard creation
Tools & Technologies Covered
Our Data Analytics Course covers the most in-demand tools used by data professionals:
SQL (MySQL/PostgreSQL)
Python (Pandas, NumPy, Matplotlib)
Power BI
Tableau
Google Sheets (for collaborative tasks)
Git & GitHub (intro to version control)
These tools are taught with real-world case studies and use-cases to enhance practical understanding.
Instructor Profile – Learn from Seasoned Industry Experts

Rashmi M. Joshi
Co-Founder & Lead Technical Trainer, Zappcode Academy
Rashmi M. Joshi, co-founder of Zappcode Academy, is an experienced IT educator with 9+ years in the tech industry. She specializes in hands-on training and project-based learning, combining real-world experience with education. Rashmi has led numerous projects in ERP, web/mobile apps, SaaS, and business automation, and is known for her strong mentorship in career planning and interview preparation.
Frequently Asked Questions (FAQs)
Anyone with basic computer knowledge – students, freshers, working professionals, or career switchers – can join this course. No programming background is needed.
The course duration is approximately 4 months, with flexible weekday and weekend batch options.
Yes, you will receive a Data Analytics Course Completion Certificate and a project-based internship certificate from Zappkode Academy.
Absolutely! We provide placement support, resume building sessions, mock interviews, and referrals to hiring partners.
No, this course is available only in offline mode at our Nagpur training center. We believe in face-to-face, hands-on learning to ensure better understanding and personalized guidance.
